EHS Software:
Reporting & Dashboards
Novara Flex simplifies data visualization and reporting, giving users easy access to actionable insights into their EHS program performance.
EHS Reporting and Dashboards in Real Time
Your data is presented in real-time, so no delay or extra steps are required to access the information.
The dashboards are configured based on features tailored to your business’s unique requirements, giving you the power to make informed decisions that impact workplace safety.
Check out the EHS Software Demo Center
Visit the demo center to watch feature deep dives and see how the mobile app ensures your safety program’s success.
Measure What Matters
Visualize EHS Program Data
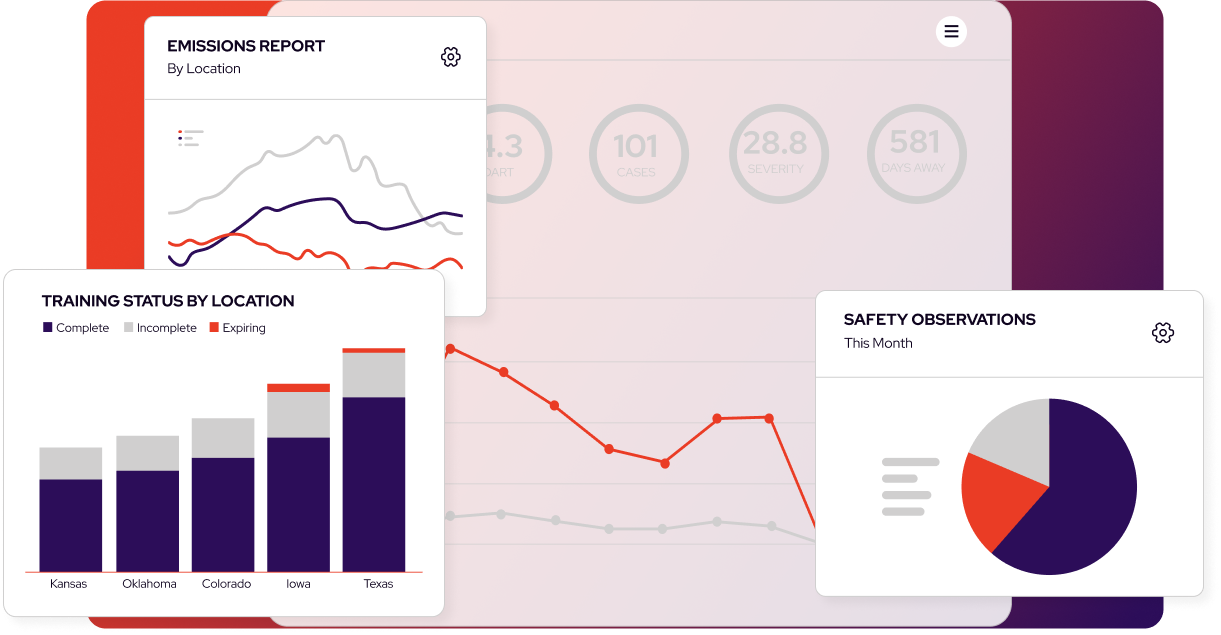
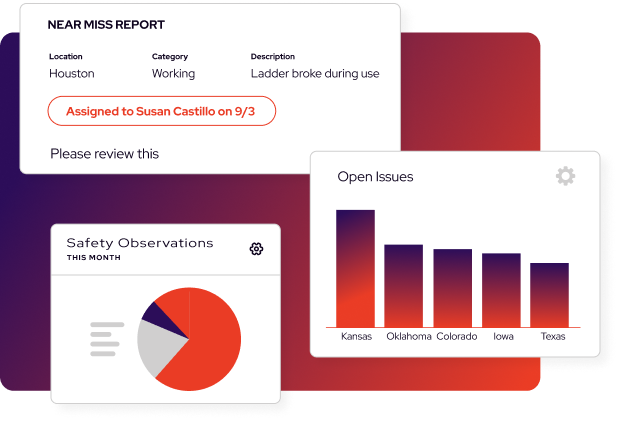
With Novara Flex reporting and dashboards, you can view metrics, top issues, and compliance percentages in a single view. Our data visualization allows you to capture metrics based on existing client application configurations (no out-of-the-box static reports) and drill down into detailed reports to see more granular underlying data. You can filter your Novara Flex data to quickly identify trends and risk indicators by location or group from training reports.


Fits Your Needs
Generate Flexible Reports
Novara Flex allows you to export reporting data for use in spreadsheet applications or other reporting programs and quickly develop executive level summaries and reports. Easily share reporting data to encourage all employees to stay committed to safety.
Gain Insight
Improve Overall Safety Performance
Use the insights provided by Novara Flex reporting to implement ongoing safety program improvements with data-driven decision-making and a view into leading indicators where potential problems could arise. Our reporting features give you greater confidence that your EHS data is current and accurate.

Simple & Automated
OSHA Case Management
Don’t let OSHA case management and recordkeeping requirements take more time and energy than necessary. Novara Flex easily manages cases, establishments, locations, and work hours. Automatically generate the required OSHA 300 forms. View and analyze statistical data like TRIR and DART.
webinar
Hear From Your Peers:
Leading & Lagging indicators
Are you using your leading and lagging indicators effectively? Combining both types of indicators can give you a comprehensive view of your program’s performance and help you achieve your EHS goals.
Watch as a Novara customer shares his experience using Novara Flex to effectively gather and use safety data, and how they transformed their safety program from reactive to proactive.

Customer Spotlight
Learn how Novara customers are saving time and money, while building a safer workforce.
The trending is just incredible with the reporting inside Novara Flex. It gives us total insight on where to focus our safety efforts.
Data Analyst, 3S Services

Recommended Resources
Here are some resources to help you build a better safety program.