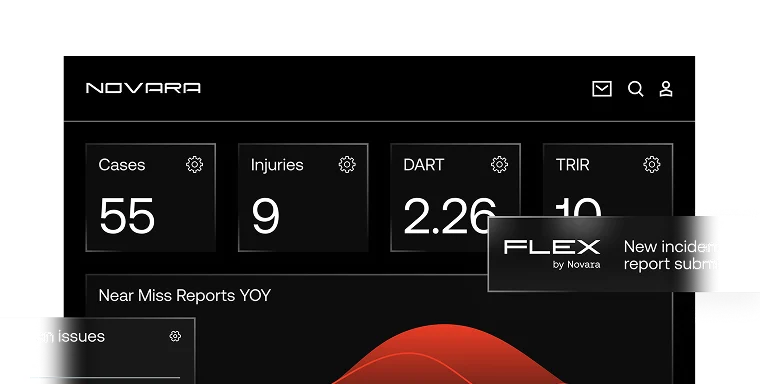
A Data-Driven Guide to Improving Workplace Safety
Read this eBook to learn the different types of safety data and best practices for using data and analytics to improve your safety program.

Staying Safe With Data and Analytics
Companies that leverage their safety data and analytics to maintain a safe workplace are setting themselves up for success. Safety leaders armed with data visuals and interpretations can make educated decisions that drive productivity, foster a strong culture of safety in the workplace, and encourage continuous improvement.
Drive Productivity
Injuries and illnesses can slow down your workforce and grind productivity to a halt. Depending on the severity, a workplace injury can result in direct and indirect productivity impacts, including:
Using data-driven safety strategies can help you avoid workplace accidents that hinder your team’s productivity
Build Safety Culture
By presenting data to your employees and opening a discussion on interpretations, you can instill a stronger safety culture through team member engagement and transparent leadership. Together, you and your team can make data-driven decisions on improving workplace safety measures.
Continuous Improvement
Effective safety leaders constantly evaluate their safety procedures and make adjustments accordingly. You can harness the power of data and analytics to identify opportunities for continuous improvement to your safety procedures.
Types of Safety Data, and How to Use Them
Most safety data can be put into one of two categories: leading indicators and lagging indicators.
Leading indicators use predictive measurements, like Near Miss Reports and Job Safety Analysis, to prevent future accidents and injuries. Lagging indicators use data points like Incidents Management and Root Cause Analysis to take a look at past performance and identify what needs improvement. Armed with a holistic view of past performance and future incidents, safety leaders can make informed decisions on how to best improve their workplace safety procedures.
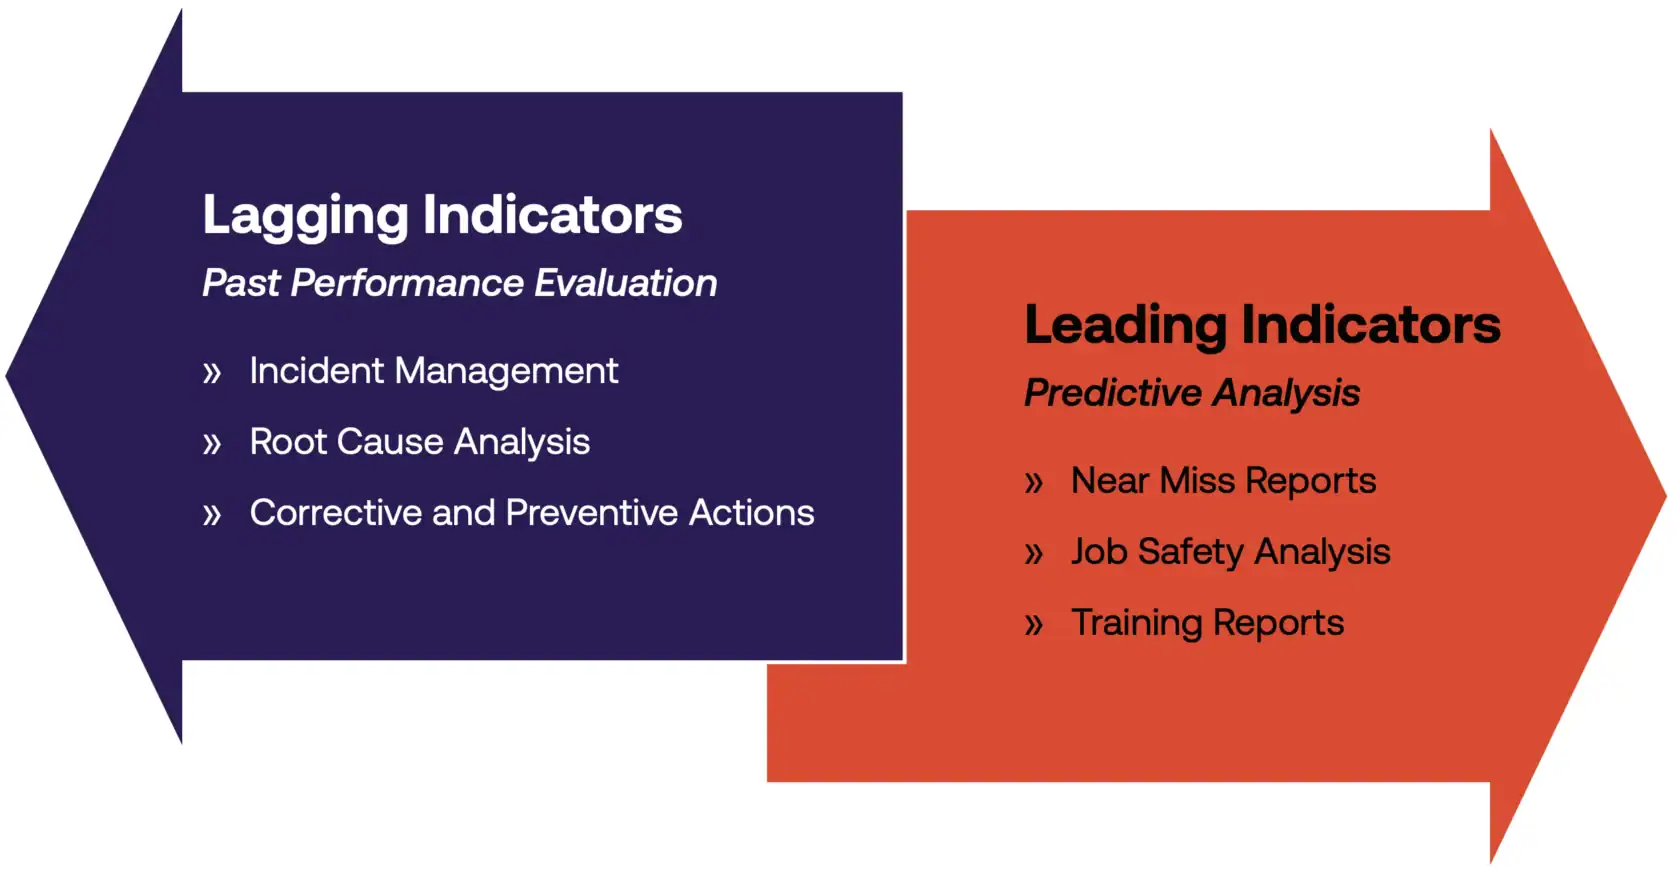
Leading Indicators are the forward-thinking reporting measurements used to predict and prevent future incidents.
Lagging Indicators are the retrospective reporting measurements that help evaluate past performance and inform future policies.
Leading Indicators and Predictive Analytics
Data is the best tool you have to reduce workplace risk. The keyword in the heading above is “predictive.” Use your safety data as a crystal ball – helping you predict the future. Keeping an eye on these leading indicators can prevent serious accidents and incidents before they happen.
Near Miss Reports
Start with Near Miss Reports. They are used to reduce potential incidents by keeping a careful record of all close calls reported to management. By tracking near misses, safety leaders can proactively prevent them from recurring, potentially resulting in more severe injuries. Organizations with a Near Miss policy and a system to capture and report them are taking the proper steps to identify and control hazards, reduce risk and prevent harmful incidents.
Job Safety Analysis
Another way to capture leading indicators is a Job Safety Analysis (or JSA for short). JSA is a reporting tool used to identify and control potential hazards associated with jobs, procedures, environments, or processes. JSA’s are an exercise in detective work to help answer questions like “What could go wrong?” and “What are the consequences?” By tracking via JSA, you can stay aware of safety concerns, inform your policies, and eliminate hazards that lead to serious accidents.
Training Reports
Training Reports are an equally crucial leading indicator. Proper training can prevent many serious workplace injuries. And pockets of employees who haven’t completed their safety training are red flags for mishaps in the future. Gain a holistic view of your companies’ training completion rates using training reports, then follow up with the laggards who may be putting themselves at risk by not completing required training. Look out for tips on training data analysis later on in this ebook!
Leading Indicator Example:
Training Data
Training reports give insight into how well your safety training programs are being implemented in your company. Using valuable data insights, you can determine the levels of training course completion and where areas of retraining are needed. Here are three important pieces of training data you can use to help improve your safety program.
Training
Completions
The percentage of training courses completed by your employees can be used as a positive leading indicator by which you can evaluate the implementation levels of your training program.
Training
Incompletions
The percentage of incomplete training courses can be used to evaluate possible risks within your company. Incomplete training courses indicate knowledge gaps in your workforce that could lead to future accidents.
Retraining
Using data on repeated accidents, near accidents, and incomplete training courses, you can make informed decisions on what retraining is needed to keep your workforce safe and prevent incidents.
Evaluating Past Performance with Lagging Indicators
Use your data and analytics tools to take account of long-term trends and evaluate the past performance of your safety procedures. Lagging indicators can help inform what improvements you can make to your future policies.
Incident Management
Reporting can help you analyze your team’s incident management in terms of preparedness, response, and recording. Incident Management analytics give you a firm understanding of your current procedures and how to improve them.
Root Cause Analysis
There’s a lot to be learned from analyzing previous injuries and incidents. Root Cause Analysis will provide a deep dive into the initial cause of accidents to prevent future harm.
Corrective and Preventive Actions
Lagging indicator analysis allows leaders to determine the corrective and preventative actions to improve workplace safety. Use your data insights to identify actionable next steps to resolve safety issues and what retraining can be enforced to prevent future accidents.
Lagging Indicator Example: Regulatory Reporting
Accidents happen. When they do, you need to record information quickly to ensure both swift action and proper reporting to avoid hefty citations and potential legal action.
In the immediate aftermath of a workplace injury, rarely is anyone’s first thought “we need to report this to the Occupational Health and Safety Administration.” Rather, initial considerations have to do with seeking medical attention, followed by rectifying the source of the incident. Then comes an assessment of the financial impact—workers’ compensation, lost productivity, potential legal claims, and so on.
But while OSHA reporting and recordkeeping may not seem as urgent as an unconscious employee or a toppled forklift, the process is a vital part of environmental health and safety management. And for many organizations, an incident that isn’t recorded and reported in a timely manner can bring significant expenses, as the minimum fine for a single late or missing report is $5,000.
Want to dive into OSHA Reporting in detail? Check out Novara’s OSHA Reporting Resource Hub
OSHA Reporting Forms and Logs
OSHA reporting and workplace safety data go hand-in-hand. OSHA gathers
safety data from companies through three main forms: OSHA Form 301,
OSHA Form 300, and OSHA 300A.
OSHA Form 301
OSHA’s Form 301 is the basic incident report after a workplace injury or illness. It collects information about the particulars of an event: the time and location of the incident, which employee or employees were involved, what occurred before and after the incident, the physician or health care professional who tended to the employee or employees, and
so forth.
OSHA Form 300
The OSHA 300 Form is an annual log of recordable cases. Every incident that requires Form 301 must also be included on that year’s Form 300. For each reportable incident, the form logs the name of the injured employee, the employee’s job title, the date and location of the injury, the kind of injury that occurred, and a brief description of the event. When a compliance officer requests information about workplace safety, they’re usually looking for Form 300—they want to review the number and severity of incidents over the past year. The shorter your Form 300, the better.
OSHA 300A
OSHA 300A summarizes all cases recorded on Form 300 for a given year. Total workrelated injuries and illnesses are tallied and categorized according to severity: deaths, cases with days away from work, cases with job transfers/restrictions, and other recordable cases. The form also shows the total number of missed workdays and job transfers/restrictions, as well as the total number of incident types (injuries, skin disorders, respiratory problems, poisonings, hearing losses, and all other illnesses). Employee names are left out.
OSHA loves acronyms and abbreviations. We’ve got two more to add to your bowl of alphabet soup: TRIR and DART are essential acronyms that you should understand when it comes to your company’s safety record.
TRIR
TRIR is the acronym for Total Recordable Incident Rate and is the number of recordable incidents per 100 employees. This number allows you to evaluate your injury rates against industry averages. Companies and customers often turn to this data point as a critical safety performance indicator.
DART
DART stands for Days Away from work, days of Restricted work activity, and days of jobs Transfer. This OSHA-mandated safety metric helps employers determine how many workplace injuries and illnesses caused employees’ work to be missed, restricted, or transferred to another job within a calendar year. OSHA monitors these results. They’re a factor in determining whether you get selected for a visit from your friendly OSHA inspector. Look for EHS software that will automate your report generation and submission. Finally, don’t think of these as solely regulatory requirements. Use this lagging indicator data to improve your safety
program.
Best Practices for Using Data and Analytics to Improve Your Safety Program
The reports you need to make data-driven decisions about your safety programs will adequately equip you to maintain a safe and healthy workforce. Use these best practices to stay on top of your evaluations and keep your safety procedures as effective as possible.
Configure Your Reports to Match Your Business
Configure the reports within your EHS software to align with both your business setup (think locations, departments, lines of business, etc.)
and your existing safety processes.
Use a Healthy Mix of Reports
Using a mix of leading and lagging indicators will give you a holistic view of your safety procedures’ past, present, and future effectiveness.
Establish an Auditable Workflow
Leading and lagging indicators show you what has happened and what may happen. But another vital piece of the puzzle is answering the question, “What’s in process right now?”
Putting together an established and documented workflow will ensure that all required tasks get completed and nothing slips through the cracks.
Novara Flex Helps Businesses Take a Data-Driven Approach to Safety
Flex simplifies data visualization and reporting, giving users easy access to actionable insights into their EHS program performance.
Your data is presented in real-time, so no delay or extra steps are required to access the information. The dashboards are configured based on features tailored to your business’s unique requirements, giving you the power to make informed decisions that impact workplace safety
Visualize EHS Program Data
With Novara EHS data and analytics, you can view metrics, top issues, and compliance percentages in a single view. Our data visualization allows you to capture metrics based on existing client application configurations (no out-of-the-box static reports) and drill down into detailed reports to see more granular underlying data. You can filter your Novara Flex data to quickly identify trends and risk indicators by location or group from training reports.
Generate Flexible Reports
Novara Flex allows you to export reporting data for use in spreadsheet applications or other reporting programs and quickly develop executivelevel summaries and reports. Easily share reporting data to encourage all employees to stay committed to safety
Improve Overall Safety Performance
Use the insights provided by Novara Flex reporting to implement ongoing safety program improvements with data-driven decision-making and a view into leading indicators where potential problems could arise. Our reporting features give you greater confidence that your EHS data is current and accurate.

The Simplicity Imperative
Have you been hesitant to adopt Safety Software? Heres a clear and simple summary of essential information about it

5 Steps to Developing Your Sustainability Strategy
Developing a strong sustainability strategy doesn't have to be overwhelming — follow these five actionable steps to build a framework that strengthens your company's brand, reduces risk, and demonstrates meaningful corporate leadership.

Never Miss a Safety Deadline Again
How to meet every deadline that comes you way!
Book A Demo
You can deliver exceptional EHS Programs with less effort. Contact us today.