What OSHA's Top 10 Can't Tell You About Your Next Serious Injury

The list hasn’t moved. The injuries haven’t stopped. That’s not a coincidence — it’s a sign the industry is watching the wrong things.
If you’ve sat through more than a handful of safety briefings, you already know the punchline. Fall protection is still #1. The rest of OSHA’s Top 10 most-cited standards reads almost exactly like it did ten years ago — same hazards, same rough order, year after year. You’ve probably felt this without ever seeing the list laid out side by side.
That’s not a small thing. It means the industry has spent a decade pointing its attention, its training budgets, and its audits at the same fixed target. And the target hasn’t asked us to look anywhere new.
Two sources anchor everything that follows: OSHA’s own citation and fatality data, and our recent industry survey, The Decision Gap, that polled EHS, operations, and safety leaders across construction, energy, manufacturing, utilities, and transportation about how their programs actually track and act on risk.
The number that should have moved, and didn’t
Here’s the one that matters most. The preventable workplace death rate sat at 3.0 per 100,000 workers in 2015. In 2024, it was 2.9 — one-tenth of a point in ten years, according to the BLS Census of Fatal Occupational Injuries and National Safety Council estimates. Including non-preventable deaths, the total rate stood at roughly 3.3 per 100,000 in 2024.
Call that what it is: stagnant. Not rising — the data doesn’t support that, and it’s a harder story to tell than “getting worse.” Flat is what happens when an entire industry throws sustained attention at the same problem and the problem holds its ground anyway. A decade of citations, training hours, and compliance spend, and the needle barely twitched.
That’s the why-now for this whole conversation. Something in the approach isn’t working, and it’s not for lack of effort.
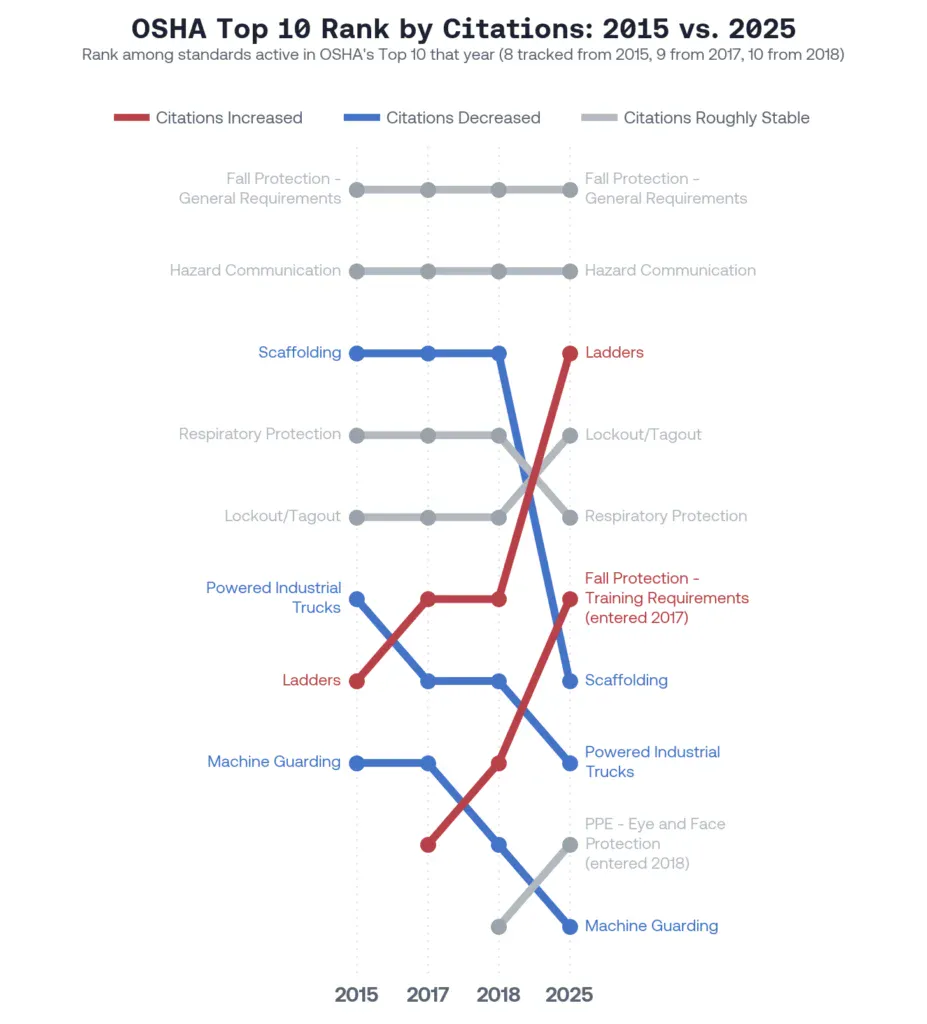
Same list, same rank, ten years running
Pull the OSHA Top 10 citation data back to 2015 and rank each standard by year. The picture isn’t just similar — it’s frozen. Eight of the ten most-cited standards in 2025 were already on the list in 2015. The same handful of standards trade the same handful of positions, year after year, with barely any reshuffling.
That’s worth sitting with. A citation list is inherently backward-looking — it tells you what already went wrong somewhere, often after an inspection followed an injury. It was never built to tell you where the next one is coming from.
That’s part of why safety institutions are starting to talk less about the Top 10 and the Safety Pyramid, and more about SIF precursors and drivers — the conditions, near-misses, and field-level signals that actually predict a serious injury or fatality, rather than a checklist of standards inspectors cited last year. Precursors live in the day-to-day of a job site, not in a citation database. They show up before something goes wrong, if anyone’s watching for them.
What the industry is measuring vs. what predicts risk
This is really two separate problems, and it’s worth keeping them apart.
The first is that most safety programs are still built around lagging indicators — OSHA recordables, TRIR, DART — because that’s what the Top 10 and decades of habit trained everyone to track. The split shows it plainly: 56% of programs report TRIR or DART as a core metric, versus 26% that report SIF precursors at all.
Those lagging numbers tell you what already happened. They’re necessary. They’re also the wrong tool for catching what’s about to happen, which is exactly the gap SIF precursors are meant to close.
The second is separate from what gets measured at all. Even where the right signal exists — a near-miss report, a hazard observation, a frontline concern — it doesn’t always land in front of the person who could act on it, in a form or a moment where acting is still possible.
That’s not a data quality problem: only 4% of programs point to distrust in their own data as the obstacle. The much bigger blockers are frontline non-engagement and leadership inaction, together cited in 53% of responses. That’s closer to a routing problem: good information, arriving too late, or to the wrong desk, to change anything.
The fix is getting the right signals — SIF precursors, not just recordables — in front of the right person while there’s still time to act on them.
Best practice is already moving this direction
None of this is a fringe argument anymore. Across the industry, the shift away from the Top 10 and the Safety Pyramid, toward precursor-based thinking, is becoming the way serious safety programs are starting to operate. It’s not a data-volume problem. It’s a routing problem — and once you see it that way, a lot of the old advice about “collect more data” starts to look beside the point.
The lag shows up in the numbers, too. 57% of programs only act on findings quarterly or less often, and just 22% act weekly or more — which works out to an average finding sitting for something like six weeks before anyone does anything with it. Meanwhile, 58% of programs hear from less than half their frontline workforce in a given month. Precursors don’t wait six weeks to matter. Neither do the people closest to them.
Where this leaves you
If the Top 10 hasn’t moved in ten years, the fix isn’t a new list. It’s paying attention to what the list was never built to catch in the first place.
That raises a harder question than whether your program is compliant. It’s whether your program can see the things compliance was never designed to catch — the near-misses, the hazard reports, the field-level signals that show up long before an incident does.
That’s where we’re headed next.
Get Your Copy
Get The Decision Gap: 2026 Benchmark
The survey stats in this piece are drawn from The Decision Gap, a survey of EHS, operations, and safety leaders across high-hazard industries — and it covers more ground than we could fit here. Get your copy of the complete results